
Bron
ClimateBonds
HSBC and the Climate Bonds Initiative have launched the 6th annual ‘Bonds and Climate Change: the State of the Market in 2017’ report at the HSBC Sustainable Finance and Investing Responsibly Briefing on the first day of Climate Week NYC.
Commissioned by HSBC and produced by the Climate Bonds Initiative, the State of the Market has become the authoritative international analysis of both the labelled green bond and ‘climate-aligned’ bond universe.
The Report quantifies all bonds where use of proceeds finance low carbon and climate resilient infrastructure. It examines bonds that finance investments compatible with a 2-degree transition path, rather than investments that are marginally environmentally beneficial.
This takes a cue from the Paris COP21 Agreement that investments should be in line with the emissions reduction trajectory needed to achieve a rapid transition to a sub-2-degree Celsius world.
The headline numbers
This year’s dataset includes all climate-aligned and green bonds issued after 1st January 2005 and before 30th June 2017.
A total of 3,493 bonds from 1,128 issuers across seven climate themes (transport, energy, multi-sector, water, buildings and industry, waste and pollution, agriculture and forestry) have been analysed in the report.
The climate-aligned bond universe now stands at $895bn outstanding – A jump of $201bn from the 2016 figure. This total is comprised of unlabelled climate-aligned bonds at $674bn and labelled green bonds at $221bn.
While $895bn provides a good picture of current climate-aligned investment in the bond market, it does not show the full potential for labelled green bond market growth.
Labelled green bonds are primarily issued by diversified companies, whereas the unlabelled portion of the climate-aligned universe is mostly pure-play issuers.
The labelling of more climate-aligned bonds as green bonds by pure-play issuers is an essential step to the shifting of capital flows, in this case fixed income investment, towards climate change solutions.
Green and Climate Aligned – What’s the difference?
Labelled green bonds: Bonds labelled as ‘green’ by the issuer and are financing green assets and projects and form the basis of green indices.
Climate-aligned bonds: This label is increasingly used to refer to bonds that are financing green/climate assets that help enable a low carbon economy, but have not been labelled as ‘green’ by the issuing entity.
Key findings: Overall Universe
- The climate-aligned bond universe now stands at $895bn outstanding – A jump of $201bn from the 2016 figure. This total is comprised of unlabelled climate-aligned bonds at $674bn and labelled green bonds at $221bn.
- The $201bn increase on 2016 includes $138bn in new bonds from existing issuers, plus $144bn from new issuers minus $81bn of matured bonds and issuers that no longer meet our climate-aligned criteria.
- In the climate-aligned bond universe, the Chinese RMB is the dominant currency (with 32% of the total amount outstanding), followed by the US dollar (26%) and the Euro (20%).
- 43% of the universe meets basic investment parameters. The majority of bonds have tenors of 10 years or more and are also government-backed.
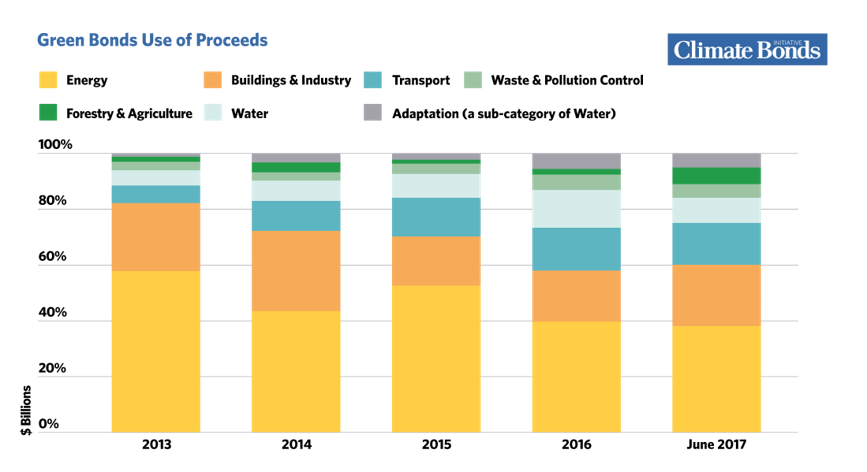
- Low carbon transport was the largest single sector, accounting for $544bn (61%) of the total $895bn climate aligned universe, followed by clean energy at $173.4bn (19%).
- Building and Industry, Agriculture and Forestry, Waste and Pollution, Water comprise 7% and Multi-Sector bonds are at 13% up from the 2016 figure of 8.2%, a small but welcome pointer towards more diversity in issuance.
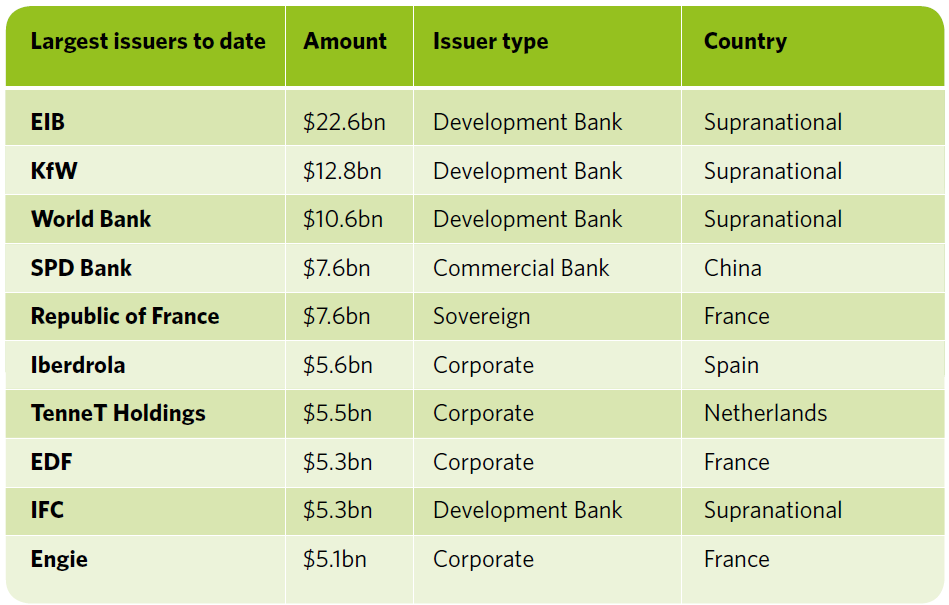
Table 1: Largest Green Bond Issuers 2005-June 2017
Key Findings: Green Bonds
- The largest labelled green bond issuers in descending order are Supranationals, USA, China, France, Germany, Netherlands, Sweden, Spain, Canada, Australia, India and Brazil.
- New York City is amongst the largest sub-sovereign bond issuers in the U.S. The city has shown leadership in supporting best practice with both the Metropolitan Transportation Authority and NYC Housing Development Corporation issuing Climate Bonds Certified green bonds.
- Globally, Development Banks are the largest green issuers with EIB, KfW and World Bank in the top three positions.
- Issuance from corporates and commercial banks has grown, but demand from institutional investors continues to outstrip supply.
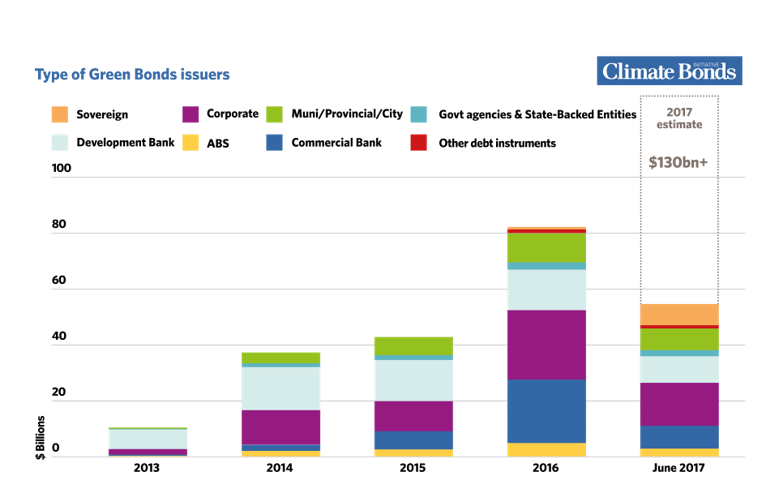
Headroom for banks and corporate issuance
Looking at market growth from 2013, there is significant headroom for more high quality green issuance, particularly from banks and corporates.
Increasing issuance from these two sectors is now a vital component in helping meet climate finance targets & country climate plans.
Table 2: Green Bond Issuers 2013 June 2016
Focus on cities and green infrastructure
70% of global greenhouse gas emissions come from cities, and many of the world’s most populated cities sit on coastlines, rivers and flood plains. For this reason, they are particularly vulnerable to negative impacts from a changing climate.
The 2017 report has a particular focus on cities with ten city based case studies identifying existing best practice in green city bonds issuance along with opportunities for new issuance.
The 5 that have successfully issued green bonds: New York, Gothenburg, Wuhan, Hong Kong and Cape Town.
The 5 potential green issuers: Amsterdam, Mumbai, Tokyo, Lagos and Medellín.
All the cities in our case studies have joined the C40 platform to share ideas and innovations around sustainability and managing climate risk.
Table 3: Green Bonds Use of Proceeeds 2013-June 2017