


Our previous research examined whether companies with high MSCI ESG Ratings were less exposed to systematic risks and therefore were more resilient to shocks during our study period. The COVID-19 outbreak — while over a very short term and limited in scope — is the first real-world test since the 2008 global financial crisis of the resilience of companies with high MSCI ESG Ratings.
The pandemic started in emerging markets (EM) and quickly spread to developed markets (DM), which have become the hardest-hit regions in terms of the number of people infected. The exhibit below shows the relative cumulative performance of four standard global MSCI ESG equity indexes integrating MSCI ESG Ratings compared to their MSCI ACWI Index parent index in the first quarter; longer-term annualized results are shown below as well.1
Relative performance of select MSCI ESG Indexes to MSCI ACWI Index

Data from Dec. 31, 2019, to March 31, 2020. MSCI ESG Universal Index represents an ESG weight-tilt approach; MSCI ESG Leaders a 50% best-in-class sector approach; MSCI SRI a 25% best-in-class sector approach; and MSCI ESG Focus an optimized approach designed to maximize ESG exposure.
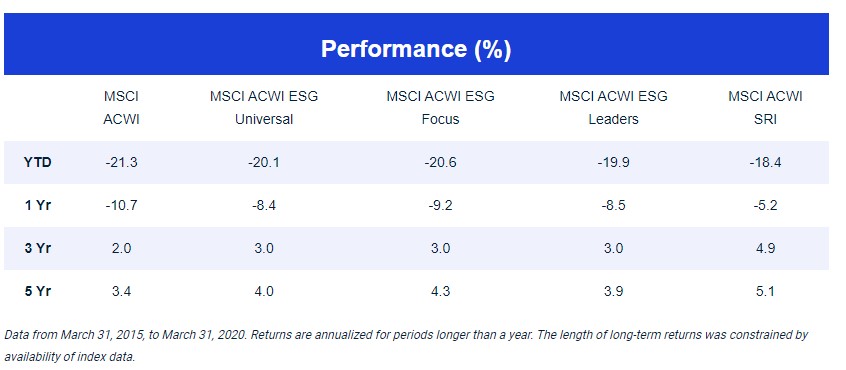
The four selected indexes representing a range of ESG index construction approaches outperformed the parent index in Q1 2020, with the SRI index showing the strongest performance over all periods.
What did performance attribution look like?
To better understand how these indexes performed during the COVID-19 crisis, we break down the active return of these indexes into factor (systematic) sources and idiosyncratic (stock-specific) sources. We use a variant of the MSCI Global Total Market Equity Model (GEM) that also includes ESG as a factor. We used factor models in performance attribution as individual factor contributions are shown net of the effect of all the other factors. Results are summarized in the tables below.
Factor attribution for MSCI ACWI ESG Indexes Q1 2020
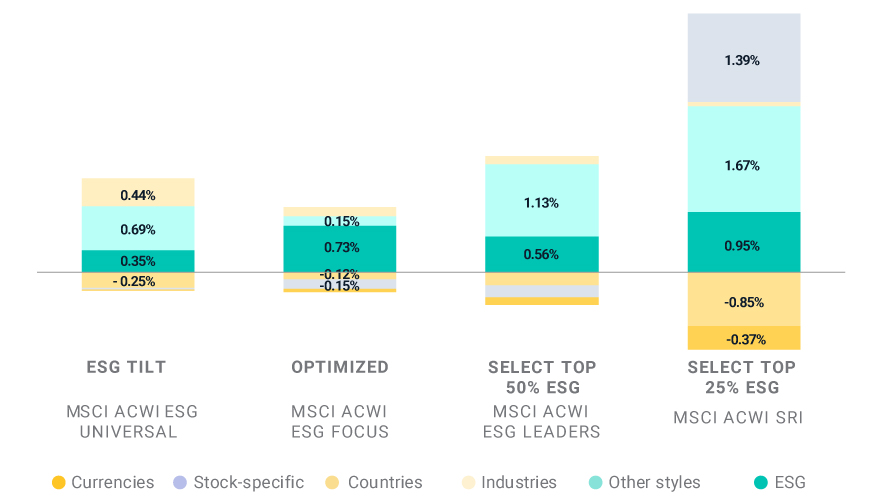
Data from Dec. 31, 2019, to March 31, 2020. Contributions below 0.15% in absolute value are not labeled.
Style factor contributions to MSCI ACWI ESG Index active returns Q1 2020
| Source of Return | MSCI ACWI ESG Universal | MSCI ACWI ESG Focus | MSCI ACWI ESG Leaders | MSCI ACWI SRI |
|---|---|---|---|---|
| Styles | 1.04% | 0.88% | 1.70% | 2.61% |
| ESG | 0.35% | 0.73% | 0.56% | 0.95% |
| Beta | 0.09% | -0.04% | 0.36% | 0.45% |
| Profitability | 0.07% | 0.04% | 0.16% | 0.21% |
| Residual volatility | 0.11% | 0.14% | 0.13% | 0.07% |
| Leverage | 0.09% | -0.01% | 0.11% | 0.17% |
| Momentum | 0.10% | 0.07% | 0.09% | 0.24% |
| Dividend yield | 0.07% | -0.02% | 0.07% | 0.17% |
| Liquidity | 0.02% | -0.01% | 0.06% | 0.05% |
| Book-to-price | 0.03% | 0.00% | 0.06% | 0.07% |
| Earnings yield | 0.04% | 0.00% | 0.05% | 0.07% |
| Size | 0.07% | -0.01% | 0.03% | 0.13% |
| Earnings quality | 0.01% | 0.00% | 0.01% | 0.00% |
| Mid capitalization | 0.01% | 0.00% | 0.01% | 0.02% |
| Long-Term reversal | -0.02% | -0.01% | 0.01% | -0.01% |
| Investment quality | 0.00% | 0.00% | 0.01% | 0.03% |
| Growth | 0.00% | 0.01% | 0.00% | 0.00% |
| Earnings variability | 0.00% | 0.00% | -0.01% | -0.01% |
Data from Dec. 31, 2019, to March 31, 2020. MSCI ESG Universal Index represents an ESG weight-tilt approach; MSCI ESG Leaders a 50% best-in-class sector approach; MSCI SRI a 25% best-in-class sector approach; and MSCI ESG Focus an optimized approach designed to maximize ESG exposure. .
Factor attribution for MSCI ACWI ESG Indexes (5 years ended March 31, 2020)
| ESG Tilt | Optimized | Select Top 50% ESG | Select Top 25% ESG | |
|---|---|---|---|---|
| Source of Return | MSCI ACWI ESG Universal | MSCI ACWI ESG Focus | MSCI ACWI ESG Leaders | MSCI ACWI SRI |
| Total active | 0.89% | 1.04% | 0.49% | 1.68% |
| ESG | 0.19% | 0.86% | 0.27% | 0.47% |
| Other styles | 0.42% | 0.35% | 0.51% | 0.95% |
| Industries | 0.20% | 0.12% | 0.00% | -0.02% |
| Countries | -0.09% | -0.07% | -0.03% | -0.19% |
| Stock-specific | 0.27% | -0.17% | -0.23% | 0.58% |
| Currencies | -0.11% | -0.06% | -0.03% | -0.11% |
Data from March 31, 2015, to March 31, 2020. Performance contributions are annualized.
As seen in the exhibits above, the outperformance of our four ESG indexes in global markets during the crisis was attributable mainly to equity style tilts. ESG was the strongest contributor, followed by tilts toward lower beta, lower volatility and better quality. Over the past five years, the ESG factor provided less significant though still relatively high levels of contribution. The methodology used to construct the MSCI ESG Leaders, ESG Focus and SRI indexes aims to reduce differences from the parent index in sector exposures. This methodology helped reduce the contribution from industry factors (sectors include numerous industries).
The positive contribution from the ESG factor, though over a limited period, supports our previous research where we found certain high ESG-rated companies were less exposed to systematic risks such as exogenous shocks. The coronavirus crisis is a recent example of such a shock.
Results by region
We now examine the performance of the same set of ESG indexes at a regional level (world and emerging markets) and a sub-regional level (U.S., Europe and Pacific) to see how they fared during the coronavirus outbreak. The results can be seen in the exhibit below.
Relative performance of global regional indexes vs. their parent index Q1 2020
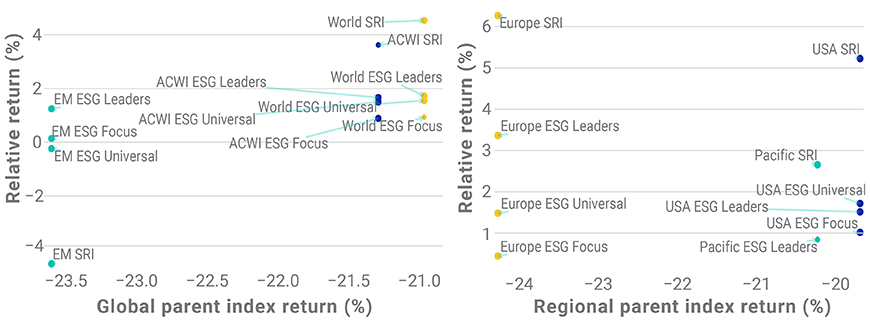
Data from Dec. 31, 2019, to March 31, 2020. MSCI Europe ESG Focus Index performance was simulated while other index returns reflect live performance. Longer-term performance is available using our index-calculation tool found on www.msci.com/end-of-day-data-search.
Within global markets, EM saw a stronger decline during Q1 2020 than DM. Within DM, Europe was hit hardest in terms of index drawdowns.
In addition, a number of regional and sub-regional ESG indexes outperformed their market-cap-weighted parent index during Q1 2020. The ESG Universal and SRI indexes in the EM underperformed during the same period.
- In all DM regions, the SRI index showed the strongest outperformance, both because of its higher exposure to style factors that outperformed and because of its larger stock-specific contribution. A full-factor attribution (see below) shows that the performance contribution from equity style factors in aggregate and the ESG factor specifically was positive for all indexes.
- In EM, the underperformance of the ESG Universal and SRI indexes was due to unintended country and currency exposures, especially for the MSCI EM SRI Index. While the MSCI SRI Index methodology is constructed to mitigate active sector and active regional exposures by performing a best-in-class selection per the Global Industry Classification Standard (GICS®)2 sector and sub-region, there can be residual unintended country exposures, which in this case resulted in a negative contribution to performance. In the case of the MSCI EM SRI Index, the underweight in the China International market and the overweight in the South Africa market accounted for most of the negative country contribution.
Factor attribution for regional and sub-regional MSCI ESG indexes Q1 2020
| Developed Markets | ||||||||||
|---|---|---|---|---|---|---|---|---|---|---|
| Source of Return | MSCI USA ESG Universal | MSCI USA ESG Focus | MSCI USA ESG Leaders | MSCI USA SRI | MSCI EUROPE ESG Universal | MSCI EUROPE ESG Focus | MSCI EUROPE ESG Leaders | MSCI EUROPE SRI | MSCI PACIFIC ESG Leaders | MSCI PACIFIC SRI |
| Total active | 1.38% | 0.82% | 1.22% | 4.20% | 1.12% | 0.34% | 2.55% | 4.75% | 0.67% | 2.12% |
| ESG | 0.30% | 0.49% | 0.60% | 0.97% | 0.27% | 0.21% | 0.48% | 0.78% | 0.52% | 0.93% |
| Other styles | 0.58% | 0.00% | 1.02% | 1.02% | 0.72% | 0.06% | 1.02% | 2.17% | 1.36% | 2.00% |
| Industries | 0.46% | 0.24% | 0.10% | -0.22% | 0.31% | -0.08% | 0.02% | 0.00% | 0.32% | 0.75% |
| Countries | 0.00% | -0.02% | 0.00% | -0.09% | 0.10% | -0.03% | 0.33% | 0.78% | -1.06% | -1.40% |
| Stock-specific | 0.05% | 0.11% | -0.51% | 2.52% | -0.28% | 0.22% | 0.63% | 0.80% | 0.35% | 1.05% |
| Currencies | 0.00% | 0.00% | 0.00% | 0.00% | 0.01% | -0.04% | 0.06% | 0.20% | -0.82% | -1.22% |
| Emerging Markets | |||
|---|---|---|---|
| Source of Return | MSCI EM ESG Universal | MSCI EM ESG Leaders | MSCI EM SRI |
| Total active | -0.18% | 0.95% | -3.57% |
| ESG | 0.27% | 0.60% | 1.03% |
| Other styles | 0.78% | 2.37% | 4.83% |
| Industries | 0.20% | 0.26% | 0.97% |
| Countries | -0.53% | -1.21% | -5.92% |
| Stock-specific | -0.52% | -0.43% | -1.24% |
| Currencies | -0.11% | -0.04% | -2.21% |
Data from Dec. 31, 2019, to March 31, 2020. MSCI Europe ESG Focus Index performance was simulated. Longer-term performance is available using our index-calculation tool found on www.msci.com/end-of-day-data-search.
Although the current conditions have only existed for a few months, we observed a positive performance contribution from ESG across four select MSCI ESG indexes (representing tilt, optimization and best-in-class selection approaches) and across some regions during Q1 2020. These results were consistent with longer-term performance. As the coronavirus pandemic continues to test markets, we will continue to monitor how these ESG indexes perform.
Guido Giese, Executive Director, Core Equity Research MSCI. This article first appeared on the website of MSCI
1This report may contain analysis of historical data, which may include hypothetical, backtested or simulated performance results. There are frequently material differences between backtested or simulated performance results and actual results subsequently achieved by any investment strategy.
The analysis and observations in this report are limited solely to the period of the relevant historical data, backtest or simulation. Past performance — whether actual, backtested or simulated — is no indication or guarantee of future performance. None of the information or analysis herein is intended to constitute investment advice or a recommendation to make (or refrain from making) any kind of investment decision or asset allocation and should not be relied on as such.
2GICS, the global industry classification standard jointly developed by MSCI and Standard & Poor’s.