


European utilities with investment grade credit ratings are generally on track to cut their CO2 emission intensity, but need to keep the momentum going. Oil & gas companies, on the other hand, still have a lot of catching up to do. In the first half of 2020, the effects of the Covid-19 pandemic and the lockdown mean that carbon emissions are expected to see an unprecedented fall in 2020. But will we continue to move in the right direction once economies reopen? Whatever happens next, the energy sector will continue to play a pivotal role as it accounts for over two thirds of total greenhouse gas (GHG) emissions and more than 80% of CO2 emissions1.
Human activity has already caused a temperature increase of approximately 1.1°C above pre-industrial levels. If emissions continue at their pre-Covid-19 rate, we could end up failing to keep within the Paris Agreement’s goal of not more than 2°C above pre-industrial levels this century. To meet these targets, the energy sector needs to make an extensive and sometimes painful switch from fossil fuel to renewables.
Global decarbonisation efforts so far have mainly focused on power generation, driven by the deployment of renewable energy. Scaling up renewables has made these energy forms competitive with fossil fuels and nuclear power in many markets. This is good news for the continued decarbonisation of global energy production. But the need for low-carbon energy continues to grow. Fossil fuels still largely have to be replaced for example in transportation, industry and heating. Clean electricity will be a significant factor in this process.
The urgency of this full decarbonisation is why we invest in the energy transition through our sustainable credit investment strategy. Measuring the CO2 performance of utilities and oil majors and monitoring targets gives us important information on how issuers tackle reducing emissions and the energy transition,and helps us make well-founded investment choices. It also gives us a basis for our engagement activities. We firmly believe that where possible companies should be encouraged in their transition to sustainable future-proof activities and regard exclusion as a last resort. This is particularly true for oil companies where successful transition can have the greatest impact.
Clear, consistent and complete reporting – relative and absolute emissions and scopes
Carbon footprints, emission scopes and carbon intensity are different ways of assessing and measuring emission levels. It is important that companies and those who evaluate their performance use these metrics consistently and transparently and do not, for example, cherry pick data to create a more favourable picture.
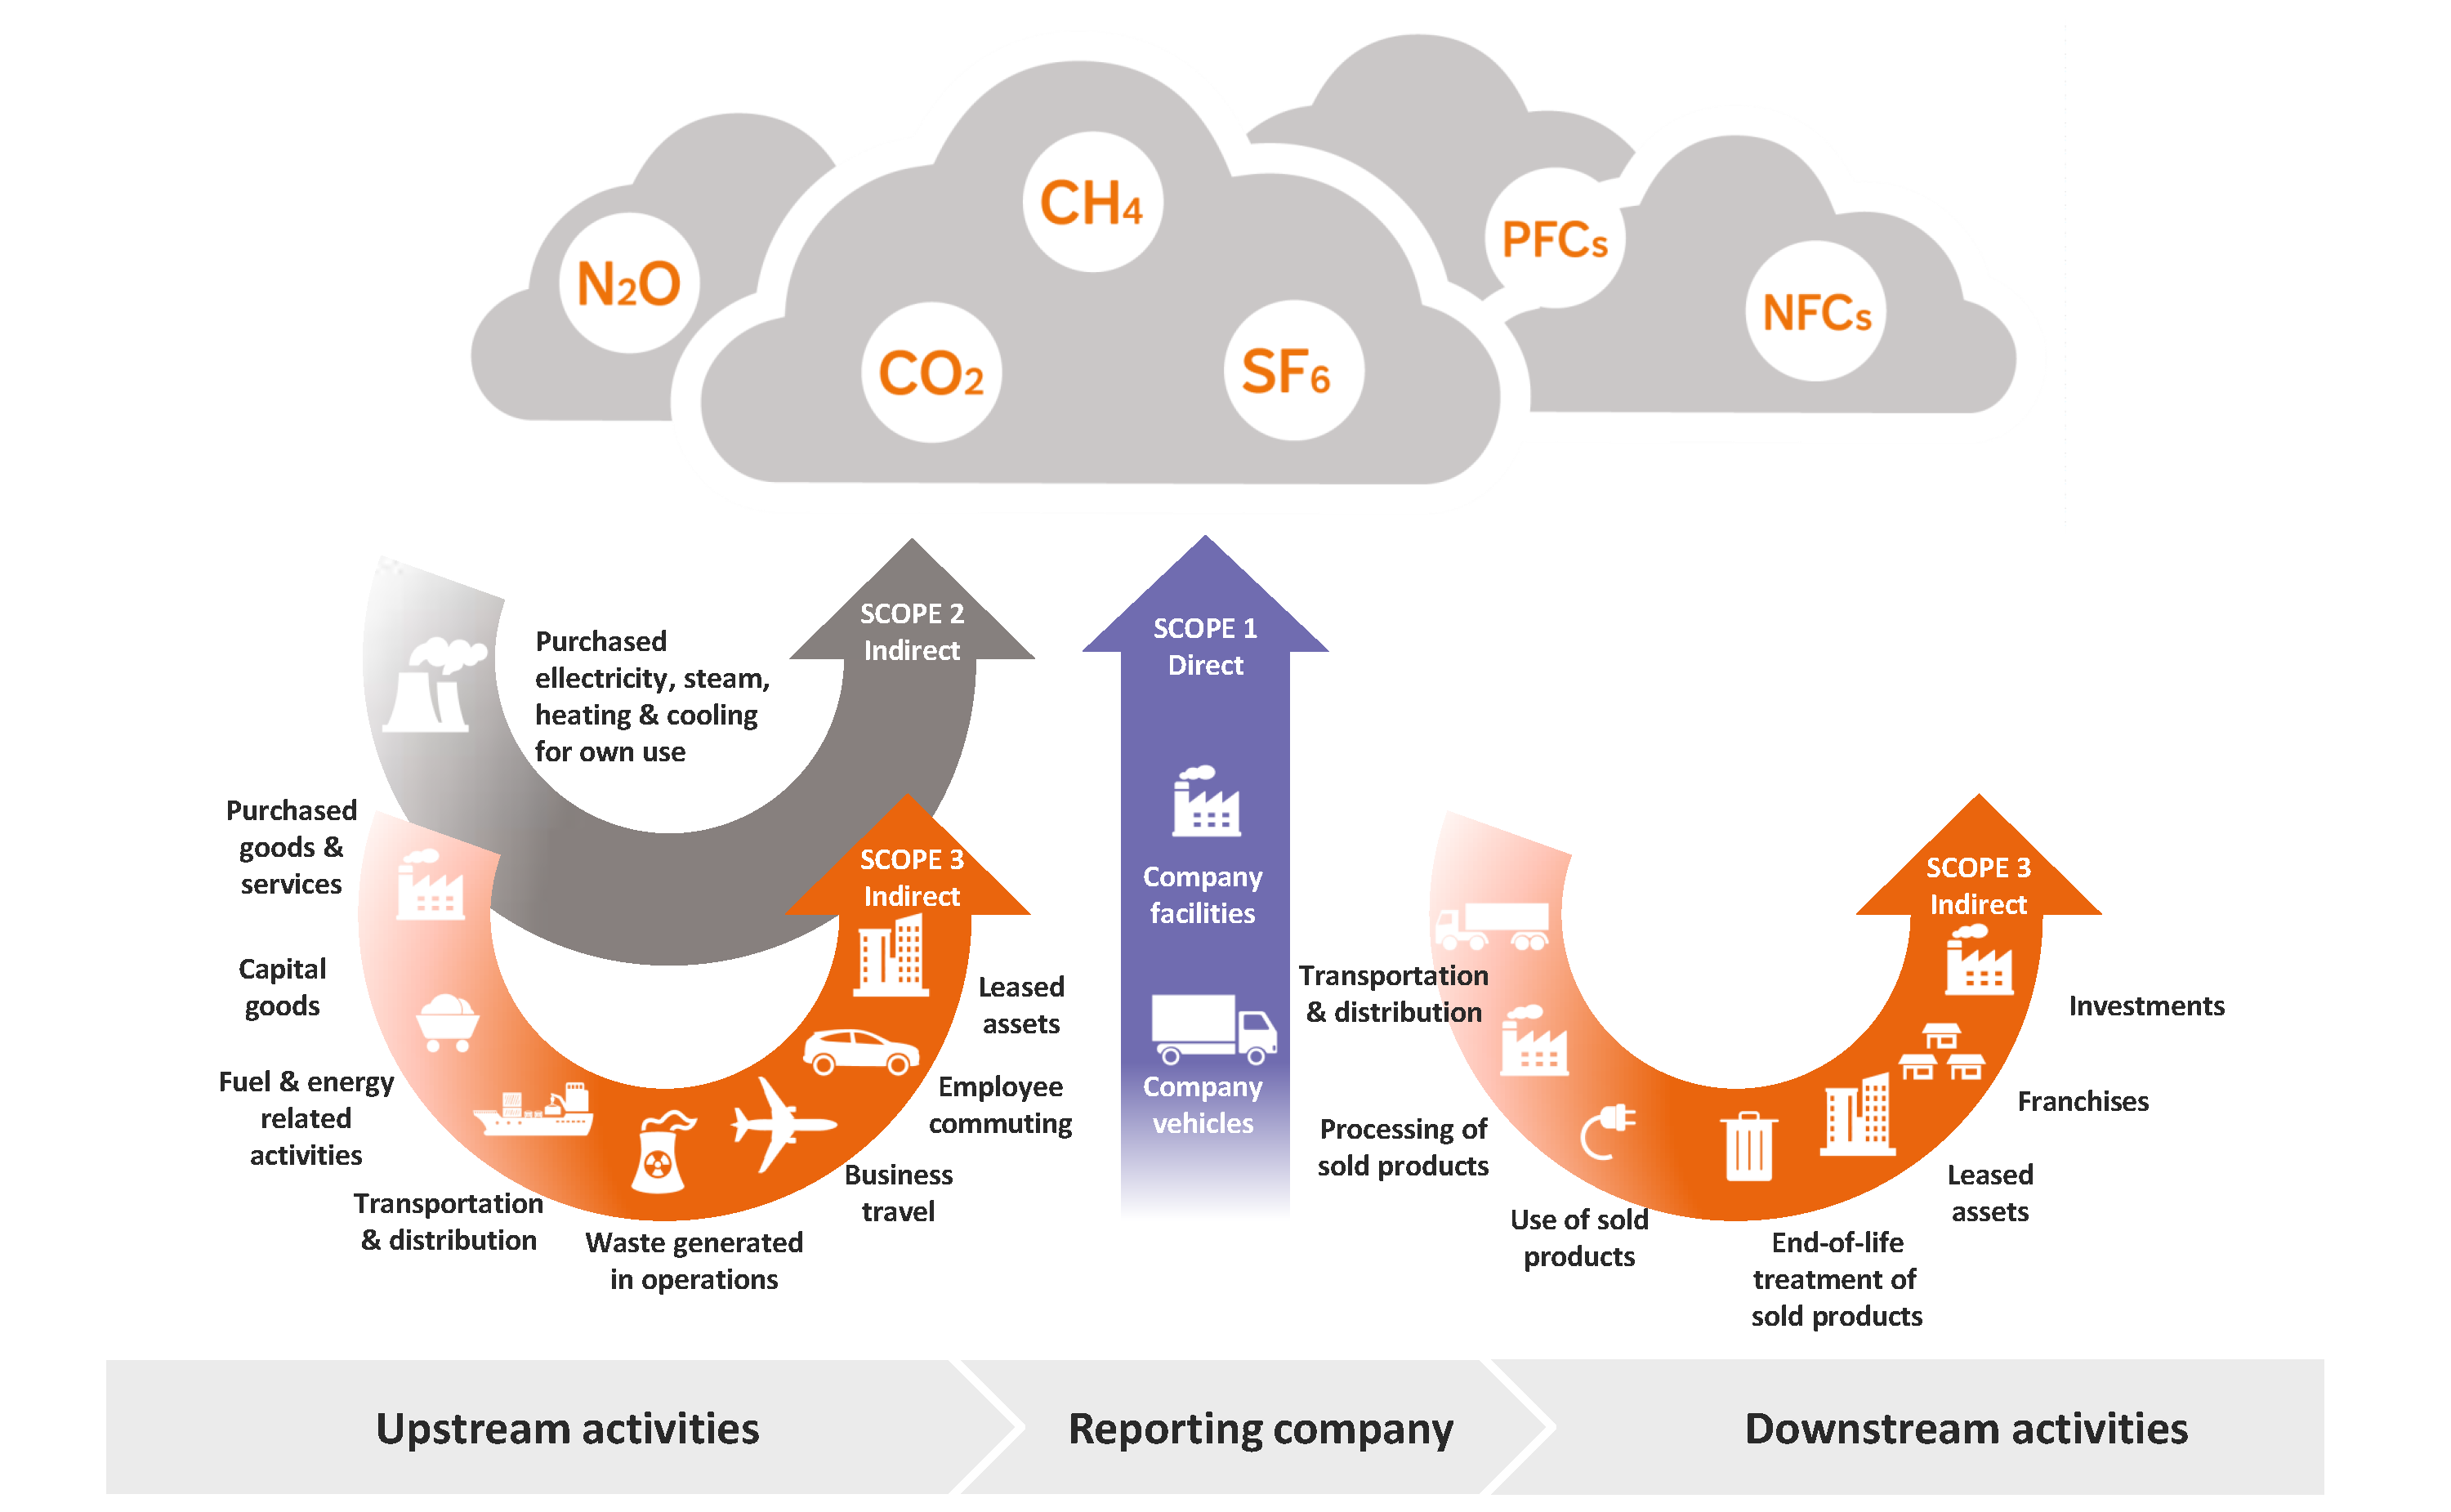
A carbon footprint is the amount of CO2 that a company releases directly or indirectly into the atmosphere. This is often defined by Scope 1, 2 and 3 emissions which break down a company’s total emissions into three different types. Scope 1 and 2 emissions are directly generated by the company (e.g. production plants) or related to its upstream activities, such as its power sources. Scope 3 includes emissions that are a consequence of a company’s operations, but aren’t directly owned or controlled by it. For example, the CO2 emitted when consumers use its products. As these activities are further removed from the company, they are not only more difficult to estimate, but also harder to control. Ideally companies should also set absolute levels of Scope 3 CO2 reduction, not just targets for Scopes 1 and 2. Often companies can continue to emit CO2 at current or even higher (absolute) levels (probably Scope 3) as long as they add sufficient low-carbon energy products to their portfolio (Scopes 1 and 2).
Sectoral Decarbonisation Approach
When analyzing carbon metrics, we prefer to use carbon intensity for our analysis. This is a metric that represents the CO2 efficiency of a company in terms of greenhouse gas emissions to revenues and is expressed in tonnes of CO2 per million euro of revenues. The Sectoral Decarbonisation Approach (SDA) helps companies set GHG reduction targets to ensure they stay in line with climate goals – to keep the global temperature increase well below 2°C compared to pre-industrial levels [2].
We use the SDA to analyse the electric utilities and oil & gas companies in our investment grade universe, because this approach allocates a 2°C carbon budget [3] to different sectors and considers their inherent differences. It also allows us compare companies more easily and track their progress. We can see whether they are on track to meet their targets, and if not, whether they are at least moving in the right direction. To compare different companies of different sizes in different businesses, emissions need to be normalised to a relevant measure. For electric utilities this is CO2 emissions in grams per kWh. For oil and gas companies, it is expressed in grams of CO2-equivalent per megajoule (MJ).
Utilities – mostly on track
Based on our analysis, many European power generating companies in our investment universe are on track to reduce their CO2 emission intensity. These plan to be carbon neutral by 2050 and have also set interim targets. But our research shows a few exceptions. The emissions of the largest German electricity utilities are a long way from reaching even the loosest scenario requirements. This is an interesting situation because the country itself has set ambitious targets. Two of the utility frontrunners in this area are Enel and Iberdrola [4] . They plan to reduce their emission intensity by 70% and 50% respectively by 2030, by phasing out coal power plants and replacing them with renewables. In the case of Enel, it is also important to note that we are comparing a company with global operations against the higher emissions targets of the European region. According to the SDA, European utilities should have an average emission intensity of 173g/kWh in the loosest scenario and 78 g/kWh in the most stringent scenario in 2030. These targets will be raised to 125g/kWh and 27.5g/kWh in 2040, respectively. These parameters help us plot the actual emission intensity data and future targets of individual utilities. As investors, we need to know whether they will be compliant with these scenarios. Figure 1 shows the carbon intensity trajectories of Iberdrola and Enel.
Figure 1: Carbon intensity trajectories for Iberdrola and Enel
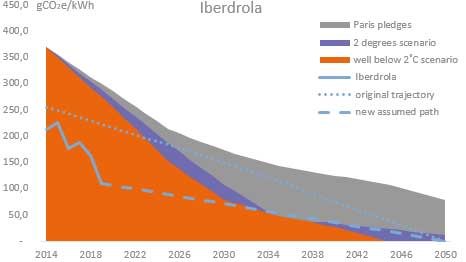
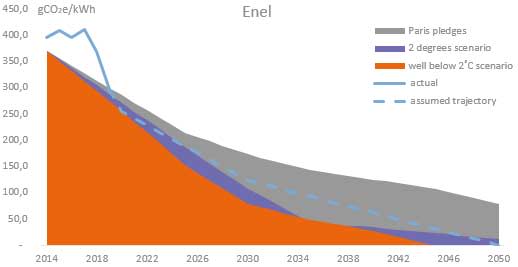 Source: NN Investment Partners
Many utilities have stated their intention to become carbon neutral by 2050 and meet the “well below 2°C scenario”. But achieving this will require increased investment to continue meeting interim targets in the run up to 2050.
Oil & Gas– still lots of work to be done
Calculating the emission intensity of oil companies is more complex. First of all, not all products are used for fuel combustion. According to the International Energy Agency, 10-15% is used for petrochemical production and should be excluded from these calculations. Secondly, oil companies produce a wide range of products with their own characteristics. And often data proves to be incomplete.
To compare the oil companies, we use the following formula [5]:
 To be consistent with the SDA, we use Scope 1, 2 and 3 emissions. For Scope 3, because of the limited or incomplete information available, we do not distinguish between emissions from use of sold products and other indirect emissions. But a quick look at the available data shows that 80-90% of Scope 3 emissions come from the use of sold products. To compare different companies, we convert physical units (tonnes, barrels) into energy units (joules) using specific energy and carbon content tables in line with the IPCC (2006).
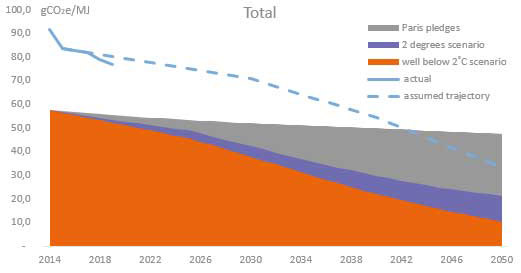
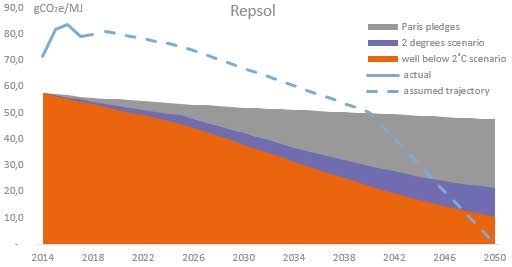
Compared to utility companies, the results of oil companies are rather disappointing, our research finds. All companies are currently above the pledged levels for the Paris Agreement and this will remain the case until at least 2040. Oil companies really need to step up their efforts. There are ample, cost-effective opportunities to cut the emissions intensity of oil and gas, according to the IEA. This can be done by minimising flaring of associated gas and venting of CO2. Other measures include tackling methane emissions and using renewables and low-carbon electricity in new upstream and liquefied natural gas (LNG) projects. Reducing methane leaks to the atmosphere is the single most important and cost-effective way (30%) for the industry to bring down these emissions.
Figure 2: Carbon intensity trajectories for Total and Repsol [4]
 Source: NN Investment Partners
On a brighter note, in the last few months several companies have revised targets to reduce emissions. Shell [4] now plans to reduce its carbon footprint by 65% by 2050 or sooner. French rival Total seeks to reduce its carbon intensity level by 60% or more by 2050. It increased its 2040 target to 35% from 25%-35% compared to 2015. BP and Eni [4] both also include Scope 3 in their target setting. We regard Repsol as one of the leaders in the oil & gas segment as it has clear targets to reduce its carbon intensity in the coming decade to become a net zero emitter by 2050. For most oil companies, carbon capture (use) and storage (CC(U)S) [6] play an important role in reducing emissions. However, these techniques are not yet economically viable.
Low-carbon future
The electrification of the economy has started and will become increasingly important in the coming decades, but conventional oil and gas products will still play an important role. Although in recent quarters oil companies have been falling over themselves to tighten their CO2 targets, it is also important to see if these are realistic. The oil majors still have a huge amount of work to do to even comply with the Paris Agreement pledges. Utilities have already made significant progress on reducing emissions. But we are not there yet. Both sectors must continue to invest in the energy transition to meet emission targets and prove they’re worth investing in.
[1] Source: International Energy Agency (IEA) [2] As described in the 5th Assessment Report of the Intergovernmental Panel on Climate Change (IPCC) [3] The method is based on the 2°C scenario, one of the IEA’s detailed CO2 sector scenarios modelled in their 2014 Energy Technology Perspectives report. [4] For illustration purposes only. Company name, explanation and arguments are given as an example and do not represent any recommendation to buy, hold or sell the stock. [5] The formula for CO2 emissions from fuel combustion is as follows: CO2 = AD x NCV x CC x COF, whereby AD is Activity Data (in tonnes, barrels, etc), NCV is the net caloric value which converts the activity data for all different fuels from “physical” units into “energy” units, CC is the carbon content which is quantity of carbon per unit of energy of a given fuel (to get from C to CO2 multiply by 44/12) and the Carbon Oxidation Factor which is the fraction of carbon in fuel which is not oxidized. Given this is a small fraction the default value is set at 1. [6] Available technology captures about 85–95% of the CO2 processed in a capture plant. A power plant with a CCS system (with access to geological or ocean storage) would need about 10–40% more energy than an equivalent plant without CCS, most of which is for capture and compression. For secure storage, the net result is that a power plant with CCS could reduce CO2 emissions by around 80–90% compared to a plant without CCS.
Annemieke Coldeweijer, Senior Portfolio Manager Euro Investment Grade Credit /Co-Lead Portfolio Manager Sustainable Credit, NN Investment Partners