


Recent proprietary research has revealed that there are a surprisingly large number of stocks with a positive impact – almost 3,000 out of the 15,000 in our chosen universe (the CS HOLT database). This is partially explained by expanding the universe to include small caps. Our results reveal that, contrary to conventional perception, positive impact companies tend to grow faster and have a lower cost of capital than those with a negative or insignificant positive impact. When the universe is adjusted for size, they also have a better cash flow return on investment (CFROI) ; an indication of financial quality. These new findings underscore our belief that financial and societal returns can go hand in hand.
Relatively new investment area
The strong and growing interest in listed impact equity is a recent phenomenon. It started to gain traction in January 2016 when the UN’s 17 Sustainable Development Goals (SDGs) came into force. These goals are intended to mobilize efforts to end poverty, fight inequality and tackle climate change. In the same year, we were one of the first firms to launch a fund that explicitly aims to achieve positive impact in the context of the SDGs by investing in listed equities.
As this is a relatively young investment area, there is much still to learn. Data is limited and there is little empirical evidence. Even institutional investors are relatively unfamiliar with this type of strategy; many regard it as risky and expect the positive impact to come at the expense of alpha and financial returns. However, our findings and database results suggest otherwise and prove that financial and societal returns are not mutually exclusive.
Table 1: Our database findings versus conventional perception
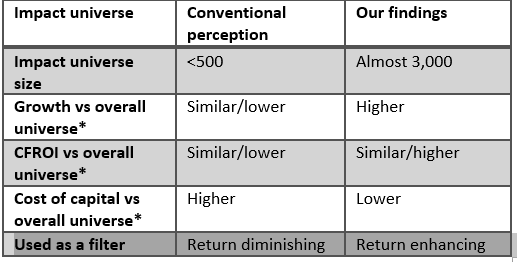 Source: CS Holt database
These findings are important because they debunk common arguments and assumptions that support the myth that, by definition, impact investing costs money or leads to worse risk-return metrics. A good understanding of the composition and characteristics of the impact universe allows us to better understand the risks and opportunities involved. These findings are also a great starting point for screening and finding a broader range of attractive impact stocks.
These results are not static: as new impact companies come to the market and others transform to become positive impact entities, the universe will expand and diversify by offering broader SDG exposure. As reporting on impact becomes more widespread, the available data will increase and improve, which will enhance the classification of corporate impact profiles. This will make it easier to track impact in a more tangible way, making the SDGs more investable and thus also help to accelerate their fulfilment.
The results also highlight the importance of fundamental analysis on which individual companies are ready to adopt more sustainable business models. We identified many companies that have a negative and positive exposure to the same SDG at the same time. Some of their current products may still have a negative impact, but others are gradually improving and cause less damage than those of their peers. These companies will enjoy a competitive advantage if and when price mechanisms or taxes have a commercial effect on such negative impact (like carbon emissions or sugar content). This is why our search for positive impact is all about net positive change.
Rating the stocks
As we invest in impact stocks, we need to have a database that allows us to rigorously screen for impact. Our impact database is now in its third phase. In the first phase, in 2016, we took the MSCI All Country World Index as our starting point as it was a familiar global index and there was plenty of external data coverage available. We built our own database to screen it and this gave us around 800 positive impact stocks. Although this was a logical place to start it meant we missed out on a large group of interesting small and midcap stocks.
In 2017, we launched the second phase by mapping SDG exposures by industry at Global Industry Classification Standard (GICS) level 4, which divides the universe into 157 industries . This proved to be a more interesting analysis than one using a traditional, less-detailed sector breakdown, but it was still not granular enough. It did, however, give us a better idea of where to systematically look for impact stocks.
In the current third phase, we started building our own database in the second half of 2017. The construction of this latest version was bottom up, starting with the 15,000 stocks available in the CS HOLT database. Our decision to use this universe was due to its size, scope and the quality of the available data. Although our universe was bigger, the screening methodology which we had been able to fine tune during the earlier phases was equally rigorous. We also built more specifically on the work we had done in the second phase, ranking the stocks by industry and rating them in three ways.
We first simply rated them on their overall positive and negative impact. We then evaluated their positive and negative exposures to each of the individual 17 SDGs. Finally, we tagged the positive impact stocks to link them to our three themes (People, Planet and Prosperity) and eight underlying impact solutions.
Figure 1: NN IP’s impact themes and solutions
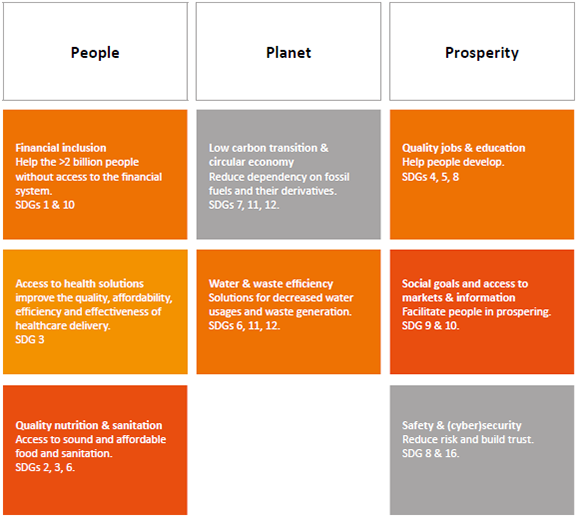 Source: NNIP
These company ratings are all judgement calls, and many are largely qualitative. They are based on company activities and partly driven by industry affiliation in the absence of industry standards. For some industries, we could assess dozens of companies at once. For example, we rated all tobacco, airline and coal companies as negative impact and advertising and custodian banking companies as neutral. However, for most it was a case of individually checking and assessing their profiles to obtain a well-balanced first impression of their impact.
The third phase will not be the last. We are continuing to update the database and are also taking it to the next level by including more raw data (Big Data) and artificial intelligence (AI) applications, both proprietary and externally sourced.
Database results and characteristics
We found almost 3,000 positive impact companies out of the 15,000 in our universe; around 19%. This is a much higher number than we had anticipated. This is not because our parameters are less strict than those of others. The more plausible explanation for this difference is that we cast the net much wider by including more smaller companies that are not included in indices like the MSCI ACWI. Although this might raise concerns among larger investors about investability, their fears are unfounded as there are many decent-sized companies outside the MSCI ACWI. Even if we exclude all companies with a market cap below USD 1 billion, there are still 1300 positive impact stocks. At roughly 20-60-20, the distribution of positive, neutral and negative impact companies is very similar to the distribution across sub-industries presented in our 2017 publication we referred to earlier.
Figure 2: Impact distribution in our database
 Source: NN IP analysis on 15,000 companies
In addition to these findings on the size and quality of the impact universe, our research also offers evidence that nuances two other popular theories about impact stocks. First that a similar company in an emerging market will have more impact than its developed market peer and second that there are more positive impact companies in the small cap segment than among large caps.
It may seem logical that the same type of company will have more impact scope in an emerging market than in a developed market: consider, for example, the access to basic needs that EM banks or telecoms can provide. So you might expect a higher percentage of impact companies in emerging markets than in developed markets. But we find no difference in the percentages of positive impact companies in these two types of market. In fact, the developed universe offsets its smaller impact scope with a larger set of companies with innovative solutions in industries like IT and healthcare. What we do see is a higher percentage of negative impact companies in EM, driven by more exposure to old-economy sectors, like mining and oil.
Size is an interesting factor. Before we started our analysis, we had expected to find a higher prevalence of net positive impact small cap stocks than large caps. After all, smaller companies are more likely to be innovative pure plays, while larger companies are more often entrenched old-economy players with negative externalities, such as airlines, oil majors and tobacco companies. In reality, this relationship is slightly different. As Figure 3 shows, there are more negative impact companies in the larger size brackets, but there is only a mildly negative relationship between positive impact and size.
Figure 3: Impact companies by size (USD)
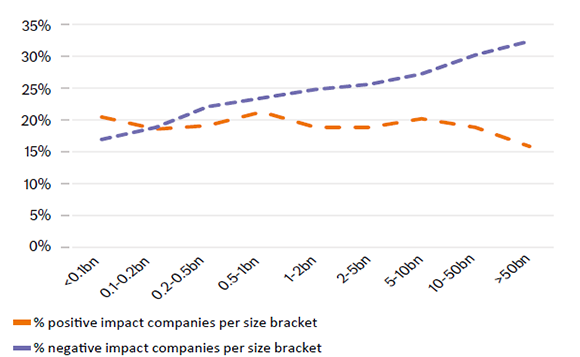 Source: NN IP analysis and CS HOLT on <3,000 positive impact companies and >3,500 negative impact companies
Impact universe distribution across themes and solutions
If we take a closer look at the distribution of our universe of positive impact companies a number of patterns also become evident. Our three major impact themes in Figure 1 are not evenly represented in the database: the number of companies exposed to “People” (57%) is twice as big as the number of “Planet” stocks (29%), which is in turn twice the size of the “Prosperity” stock segment (14%). So the exposure to our eight impact solutions is also skewed, with “Access to health solutions” (45%) and “Low carbon transition & circular economy” (18%) together accounting for over 60% of all stocks in the positive impact universe.
Figure 4: Distribution across impact themes and solutions
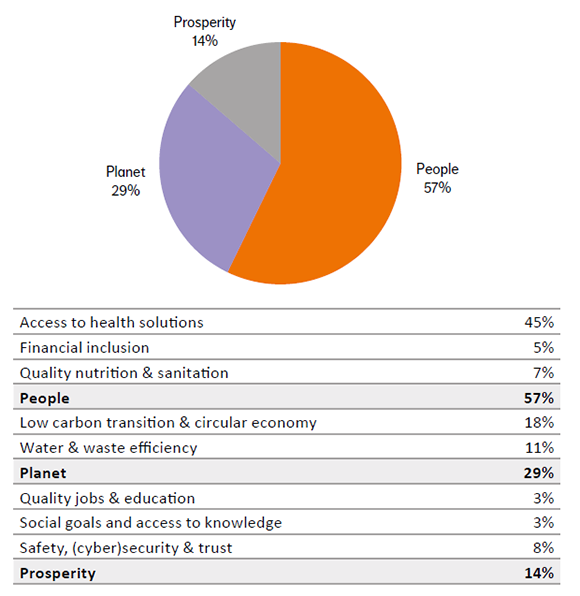 Source: NN IP analysis on just under 3,000 impact companies
In addition, the “Prosperity” stocks tend to be harder to identify. They are more heterogeneous in their products and activities than the “Planet” and especially the “People” stocks, and they correspond less closely to traditional industry classifications.
Value drivers Our findings also show that impact companies score better on three major value drivers: • Return on capital (spread of CFROI over cost of capital) • Growth • Cost of capital (discount rates)
Initially, positive impact companies seem to have slightly weaker short-term data when it comes to value creation than the rest of the universe, with a spread of CFROI over their cost of capital of 2.7% versus 2.9% for neutral or negative companies. However, if we exclude companies with a market cap below USD 1 billion, this difference becomes 7.3% versus 4.9%, with positive impact companies clearly delivering higher quality returns. Among the companies with a market cap below USD 1 billion, there are more innovative, early stage companies in immature industries, which tend to have a lower CFROI.
Figure 5: CFROI 3-year median minus HOLT discount rate
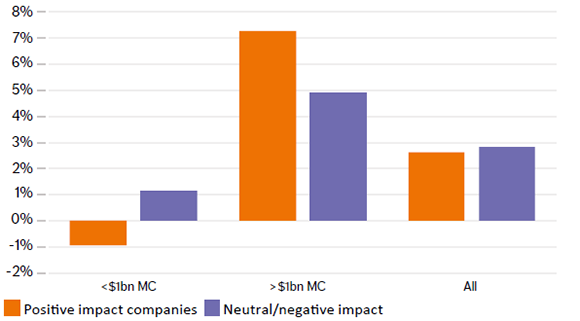 Source: NN IP analysis and CS HOLT on 15,000 companies
There are also big differences within the positive impact group, and across solutions, with all but two (“Access to health solutions” and “Low carbon transition”) containing more value creating companies than the neutral and negative impact spaces. The lower scores for “Access to health solutions” can be explained by the large number of young innovative companies (especially in biotech) that still need to prove that their solutions are effective, and that they can achieve scale and generate decent returns.
The picture is clearer for the other two value drivers – positive impact companies grow faster and have lower discount rates. Their higher growth rates make intuitive sense. They tend to be more innovative and benefit from SDG tailwinds, and they are not usually involved in sunset industries. Perhaps more surprisingly, these same issues also explain the lower discount rates of positive impact companies, since they make companies more resilient and less cyclical. These relationships also still mostly hold true when looking at the positive impact universe at industry and solution level.
Figure 6: Sales growth and discount rates
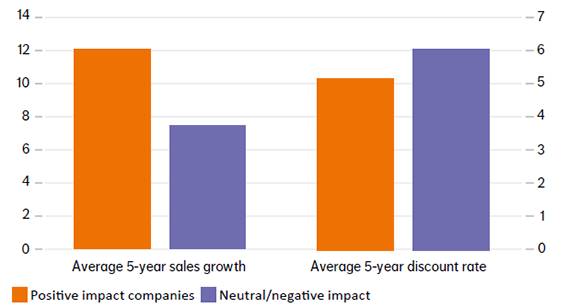 Source: NN IP analysis and CS HOLT on 15,000 companies
Conclusions
By building this new database, we have discovered a large and diverse impact universe of almost 3,000 stocks. This impact universe also turns out to be of higher quality than the overall universe: higher growth, higher quality returns on capital, and lower cost of capital (discount rates).
The impact universe provides us with an effective screening tool to help find the most attractive portfolio candidates for our listed equity impact fund. We identify the industries and companies that offer the most powerful solutions and the best exposure to societal transition risks (e.g. carbon pricing). They are most likely to continue to generate both corporate financial success and societal value, and hence offer highly attractive risk-return metrics.
As markets change and the focus on impact stocks increases, we will further expand our insights and knowledge on the nature of impact exposure and to also validate our results with external data and AI analysis.
Willem Schramade,