
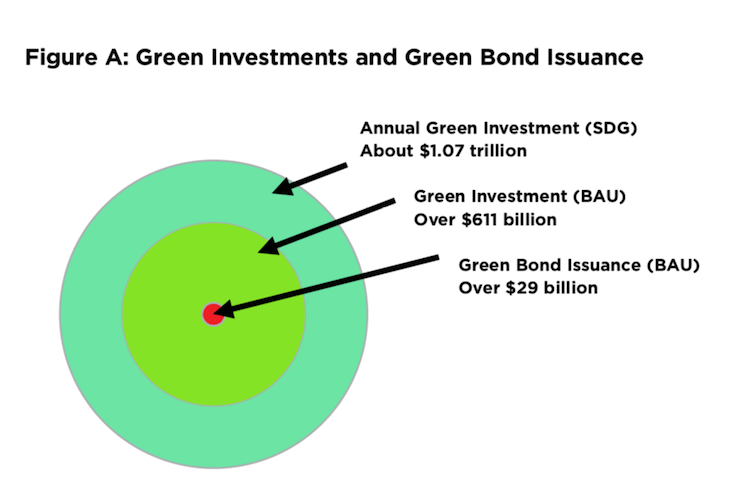
While 17 per cent of current investment by large public corporations is already green, there’s an urgent need to mobilize even more capital to help build a lower-carbon and more sustainable economy. And while less than five per cent of 2017 corporate green investments were financed via certified green bonds, they have the potential to play a much larger role. Corporate Knights and Climate Bonds Initiative assessed 7,000 of the world’s largest companies, representing all publicly traded companies with US$1 billion+ in revenues. Collectively, these companies were found to have made capital and research and development expenditures of $3.6 trillion in 2017. We then applied a recently developed, sector-specific taxonomy to determine what proportion of their revenues – and, by extension, their capex and R&D – can be classified as having clear and specific environmental benefits. This yielded a figure of $611 billion in green investments by non-financial sector corporations in 2017.
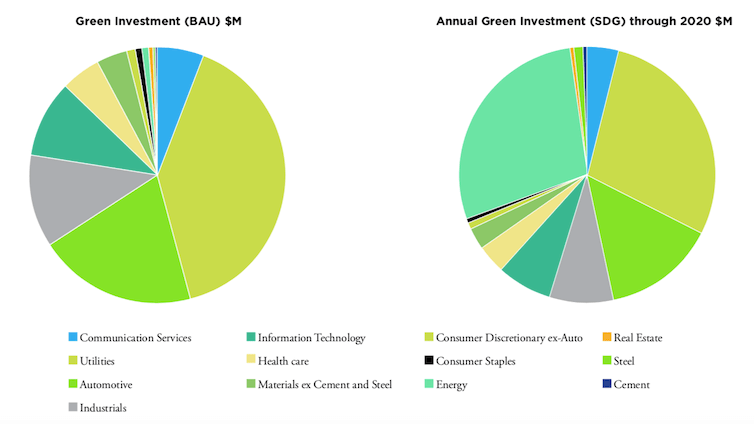
In order to reach “SDG alignment”– which must include urgent action to combat climate change we estimate that total corporate capex and R&D spending needs to be boosted from $3.6 trillion to $3.8 trillion annually, while the green component of that investment needs to rise from $611 billion (17 per cent of the total) to about $1.07 trillion (28 per cent of the total). Over 87 per cent ($399 billion) of the additional annual green investments required arise in the most transition-exposed sectors (energy, utilities, automotive, steel and cement).
While large, the incremental investment requirement identified in the report is modest in proportion to the estimated $117 trillion in assets under management and loan books held via publicly traded financial corporations. There is also strong and growing investor interest in financing green activities. But with 2018 annual issuance of certified corporate green bonds of only $78 billion (including $49 billion from financial corporations and $29 billion from non-financial corporations—the same figure for 2017), much stronger linkages are needed between green-motivated capital providers and the corporate initiatives that urgently require such funding. Potential solutions include:
- Agreement on taxonomies and definitions for green activities, revenues and investments, in particular to facilitate “Clean Transition Bonds” – a form of green bond that would finance de-carbonization activities within high-carbon sectors that would otherwise likely be bypassed by conventional green bond issuers.
- Broader efforts on the part of banks and other financial issuers to raise and recycle capital through securitization of their green loan books (the report estimates banks have outstanding fgreen loan books of $390 billion, which could be securitized and issued as green bonds).
- A move away from strict, in-or-out specifications of how green bonds proceeds are used by companies, in favour of an approach though which companies that pass a credible test for their own SDG-alignment would see all of their debt issuance qualified as green.
This report also evaluates the green bond issuance potential of a representative cross-section of 21 of the 2019 Global 100 Most Sustainable Corporations in the World. This includes a determination of likelihood of green bond issuance, and percentage of green investment requirements that could be covered by such an issuance. These companies alone have incremental green capital requirements of approximately $43 billion annually in order to move to full SGD alignment, a significant portion of which could be covered by green bond offerings.
Download the full report: 2019_Corporate_Green_Investment (pdf)
Annual Corporate Green Investment |
||
| GICS Sector(1) | Green Investment (BAU) | Green Investment (SDG) |
| Communication Services | $35,977 | $44,396 |
| Consumer Discretionary excluding Auto | $7,346 | $9,065 |
| Automotive | $121,915 | $150,430 |
| Consumer Staples | $6,132 | $7,567 |
| Energy | $4,281 | $302,118 |
| Cement | $142 | $4,220 |
| Steel | $539 | $11,915 |
| Health care | $30,515 | $37,656 |
| Industrials | $71,551 | $88,294 |
| Information Technology | $59,209 | $73,064 |
| Materials excluding Cement and Steel | $23,642 | $29,175 |
| Real Estate | $4,183 | $5,162 |
| Utilities | $245,600 | $303,071 |
| Total | $611,033 | $1,066,131 |